In the modern business environment, data is often referred to as “the new oil.” However, raw data, much like unrefined oil, is messy, difficult to handle, and inherently useless until it is processed. For companies running their operations on Odoo, the database is often overflowing with valuable information—sales orders, inventory movements, manufacturing times, and invoice statuses. Yet, many executives still find themselves drowning in spreadsheets or waiting for end-of-month reports to understand the health of their business.
This is where the Odoo Dashboard module steps in. It is the refinery that turns raw data into high-octane actionable insights.
For CEOs, CFOs, and operational managers, the Odoo Dashboard isn’t just a “nice-to-have” add-on; it is the command center for effective decision-making. This article explores why Odoo Dashboards are the superior choice for business intelligence (BI) within the Odoo ecosystem and how they can transform the way you lead your company.
The Problem: The “Data-Rich, Insight-Poor” Paradox
Most ERP implementations suffer from a common paradox: the system captures everything, but the user sees nothing.
A standard ERP user interface is designed for data entry and process management. A sales agent needs to see a list of quotations; an accountant needs a list of journal entries. But a decision-maker does not need lists. They need trends, ratios, and exceptions.
Without a proper dashboarding tool, decision-makers often resort to:
- Exporting data to Excel manually (prone to error).
- Asking IT for custom reports (slow and costly).
- Making “gut feeling” decisions because the data is too hard to access.
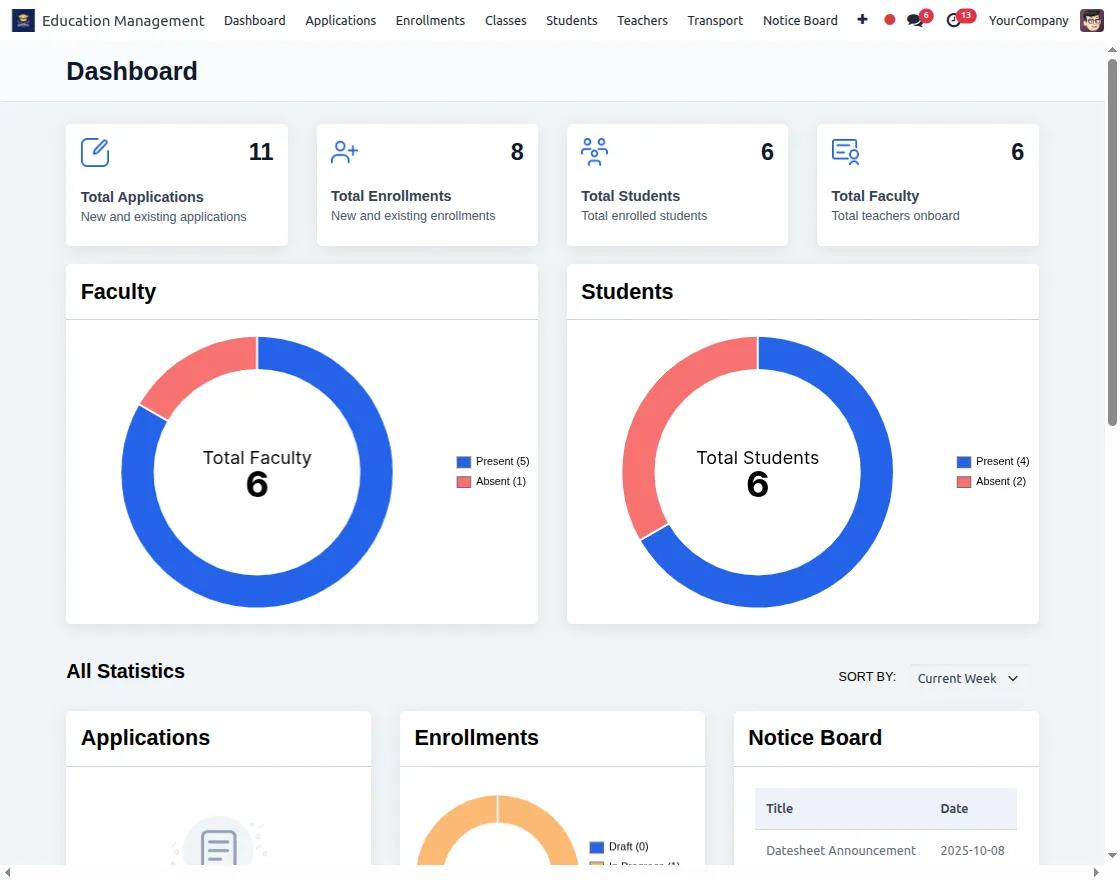
Odoo Dashboards solve this by visualizing real-time data directly within the platform where the work happens.
Why Odoo Dashboards Beat External BI Tools
A common question is: “Why shouldn’t I just connect Odoo to PowerBI or Tableau?”
While external Business Intelligence tools are powerful, they introduce friction. They require data warehousing, connectors, and often have a sync delay (latency). The Odoo Dashboard module offers three distinct advantages over external tools:
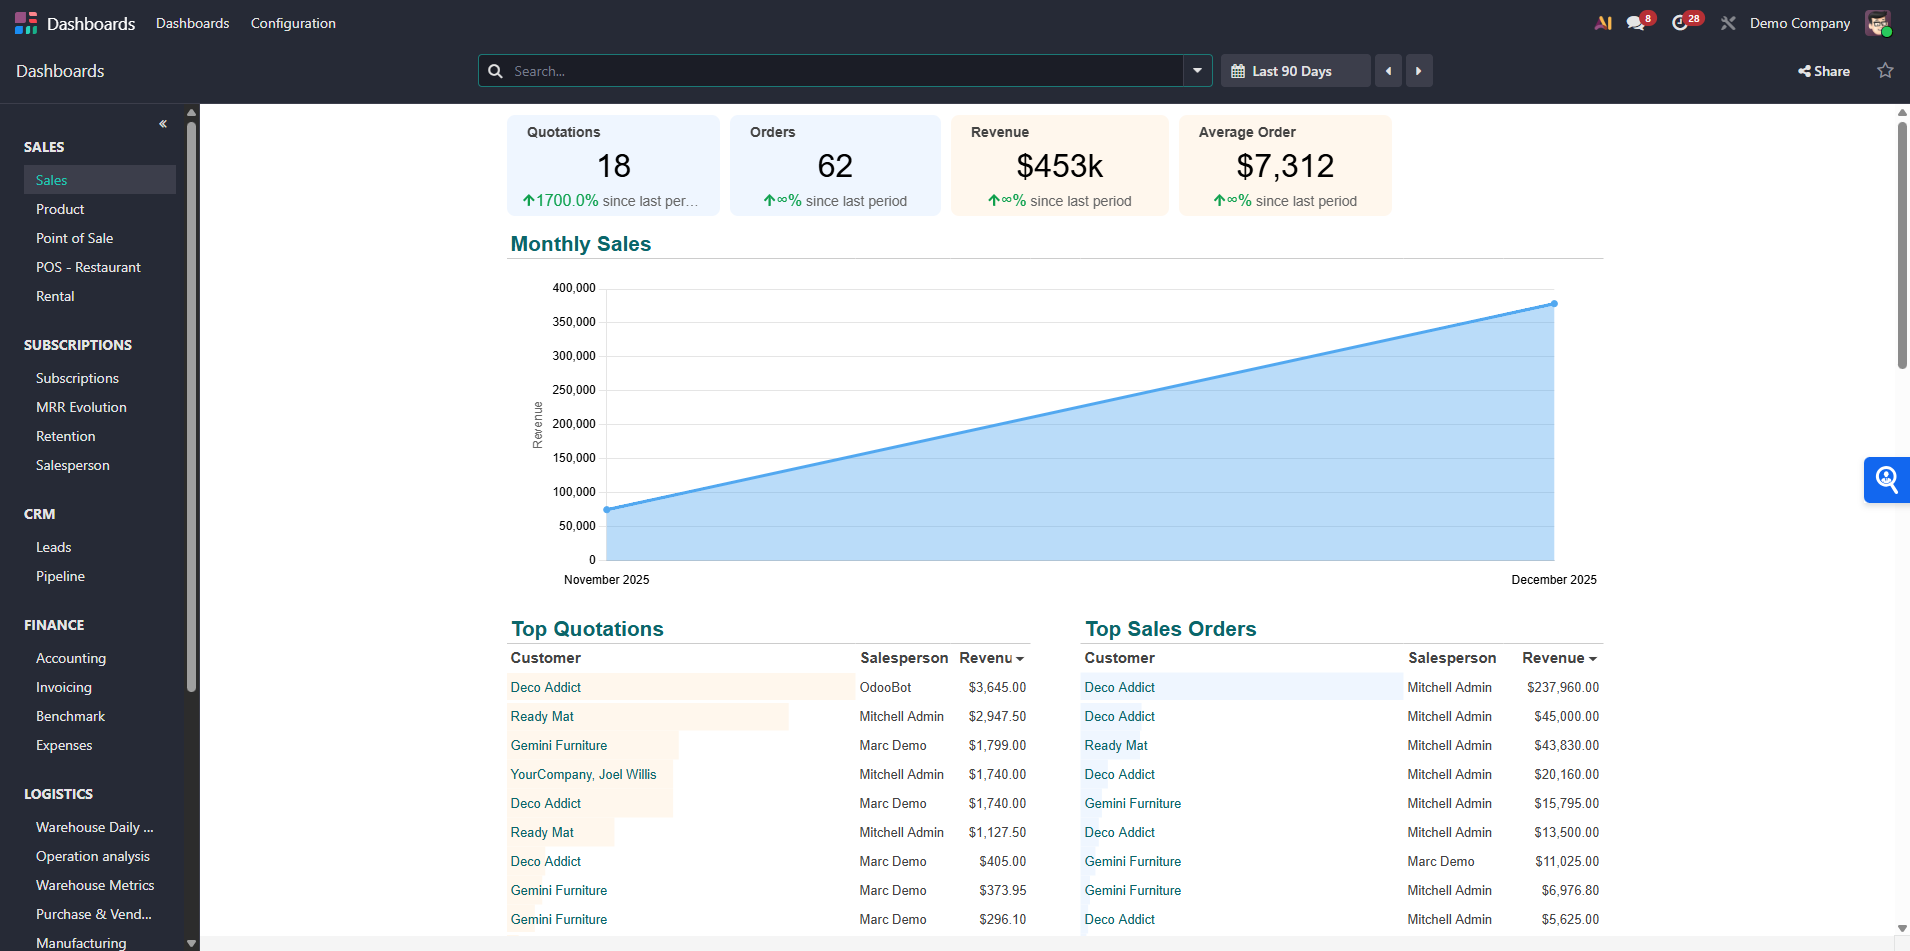
- Real-Time Data (Zero Latency): When a salesperson confirms an order in Lusaka, the sales graph on the CEO’s dashboard updates instantly. There is no “refresh schedule” or 24-hour delay. You are making decisions on live data.
- Drill-Down Capability: This is the killer feature. In PowerBI, if you see a spike in expenses, you see a number. In Odoo Dashboards, you can click that number, and it takes you directly to the specific vendor bills that caused the spike. You go from “What happened?” to “Fixing it” in two clicks.
- Contextual Action: You don’t just view data; you act on it. If a dashboard shows inventory is low, you can click the item and issue a Request for Quotation (RFQ) immediately without switching apps.
The Game Changer: Odoo Spreadsheet
Starting from recent versions (Odoo 14 and significantly improved in Odoo 17/18), Odoo integrated a full-featured spreadsheet engine directly into the core. This is not an export; it is Excel living inside your ERP.
For decision-makers, this bridges the gap between the flexibility of a spreadsheet and the reliability of a database.
- Formulas: You can use standard formulas (SUM, AVERAGE, VLOOKUP) that pull live data from your Odoo database.
- Global Filters: You can create a master dashboard with a “Date Range” filter. When you change the date from “Last Month” to “This Year,” every graph, chart, and KPI card on the screen updates instantly.
- Formatting: If you know how to use Excel or Google Sheets, you already know how to build a custom Odoo Dashboard. The learning curve is practically non-existent.
Tailored Dashboards for Every C-Suite Role
The true power of the module is revealed when it is customized for specific roles. Here is how different decision-makers leverage Odoo Dashboards.
1. The CEO: The “Pulse” View
The Chief Executive needs the helicopter view. They don’t need to know which specific truck delivered a product, but they need to know if the company is growing.
- Key Metrics: Year-over-Year (YoY) Revenue Growth, Gross Margin %, Total Cash Position, Top 5 Customers.
- The Win: The CEO can log in every morning and see a “Traffic Light” system. Green means good, red means attention needed. It focuses executive energy on problems, not maintenance.
2. The Sales Director: The Pipeline Command
Sales leaders live and die by their pipeline.
- Key Metrics: Win/Loss Ratio, Expected Revenue vs. Target, Activities per Salesperson, Leads by Source.
- The Win: Odoo Dashboards allow the manager to spot a “lazy” sales rep or a low-performing product line immediately. They can visualize the sales funnel to see exactly where deals are getting stuck (e.g., “Why do 40% of deals stall at the ‘Proposition’ stage?“).
3. The CFO: The Financial Watchdog
For the Chief Financial Officer, accuracy and liquidity are king.
- Key Metrics: Aged Receivables (who owes us money?), Aged Payables, Current Ratio, Operating Expense Ratio.
- The Win: Instead of waiting for the 15th of the next month for the closing report, the CFO can track the Daily Cash Burn Rate. They can click on the “Overdue Invoices” graph and send automated reminders to customers directly from the view.
4. The Operations/Inventory Manager: The Efficiency Engine
Supply chain decisions require precise timing.
- Key Metrics: Inventory Turnover Ratio, Stock Outs, Delivery Delay Analysis, Manufacturing Efficiency (OEE).
- The Win: The dashboard can highlight “Dead Stock”—items that haven’t moved in 180 days—allowing the manager to run a promotion to clear space and free up cash.
Designing for Decisions: Best Practices
Implementing Odoo Dashboards is easy, but designing effective ones requires discipline. If you decide to build this for your team, follow these rules:
1. The 5-Second Rule A decision-maker should be able to look at the dashboard and understand the status of the business within five seconds. If they have to squint, scroll, or calculate numbers in their head, the dashboard has failed. Use colors (Red/Green) and simple KPI cards to communicate status instantly.
2. Avoid Vanity Metrics “Total number of website visitors” is often a vanity metric. “Conversion rate from visitor to lead” is an actionable metric. Only display data that leads to a decision.
3. Mobile Optimization Decision-makers are rarely at their desks. Odoo Dashboards are fully responsive. Ensure your layout works on a smartphone screen so your CEO can check the daily sales figures while waiting for a flight.
How to Get Started
You do not need to be a developer to start using this.
- Navigate to the ‘Dashboards’ module in your Odoo enterprise apps.
- Choose a Template: Odoo comes with pre-built templates for Sales, Accounting, and Inventory. Start there.
- Insert in Spreadsheet: Go to any list view (e.g., Sales Orders), filter the data (e.g., “Sales this month”), and click “Insert in Spreadsheet.”
- Visualize: Once the data is in the spreadsheet, turn it into a pie chart or bar graph and add it to your main dashboard view.
Conclusion
In a competitive market, speed is the differentiator. The company that identifies a downward trend in sales on day 3 of the month will beat the company that notices it on day 30.
Odoo Dashboards provide that speed. They democratize data, moving it out of the hands of IT specialists and into the hands of the people who actually run the business. By leveraging the seamless integration of the Odoo ecosystem, you ensure that your strategic decisions are based on the single source of truth—your live database.
Stop managing your business through the rear-view mirror of last month’s reports. Turn on Odoo Dashboards and drive with your eyes on the road ahead.